Statistics
Once you have started migrating data using Hopp your project can quickly and easily be checked. In Statistics, you can see the status of the migrated Business Objects.
The page has two sub-menus - Disposition and Impact - which both display high-level statistics for the migrated Business Objects.
The Partition Box allows you to see the statistics aggregated for the entire migration or for each partition. The lists can be exported to an Excel spreadsheet.
Disposition
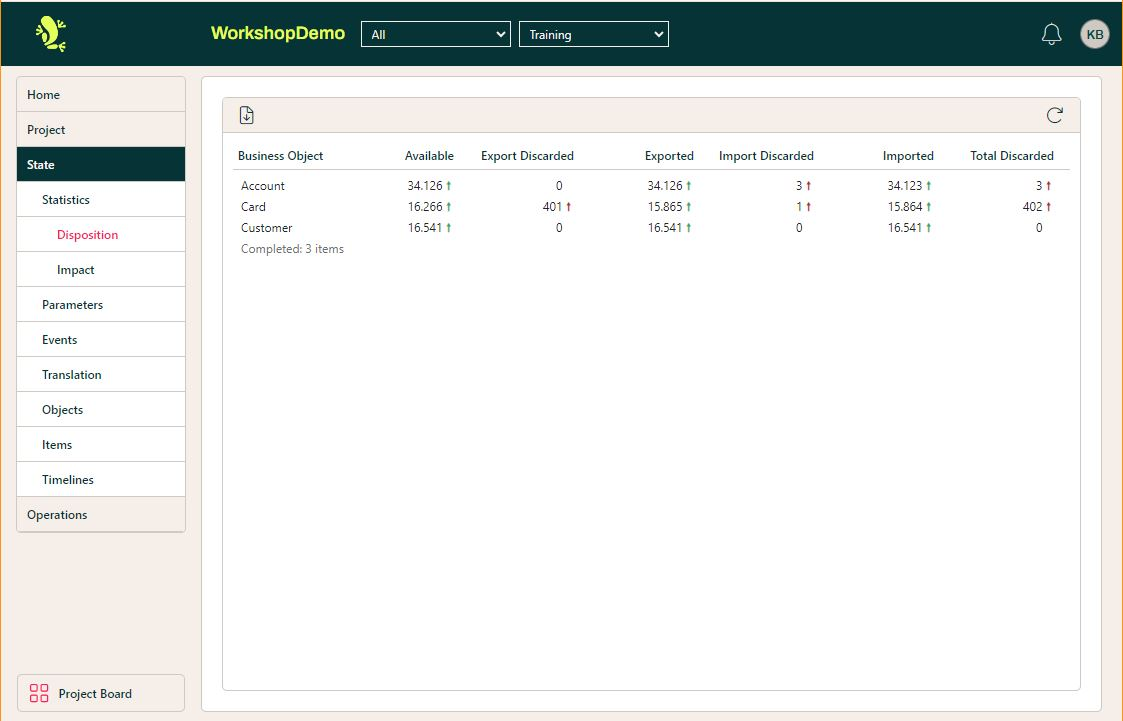
Each column shows the number of objects within the business object which
- are available
- have been discarded in export (failed to pass export)
- have been exported (passed export)
- have been discarded in import (failed to pass import)
- are imported (passed import and is ready to be migrated)
- have been discarded in delivery (rejected by the target system)
- have been delivered (accepted by the target system)
- have been discarded in total (export, import and delivery)
The two delivery columns, Delivery Discarded and Delivered, come from Delivery Feedback. They are shown after the Import columns only when the listed statistics contain delivered or delivery-discarded objects. Only objects that were imported can be counted in delivery.
The columns Available, Imported, and Total Discarded are used in the Dashboard. When the selected track and partition have delivered or delivery-discarded objects, the Dashboard shows Delivered instead of Imported, and the objects not yet processed are those that have been neither delivered nor discarded.
Impact
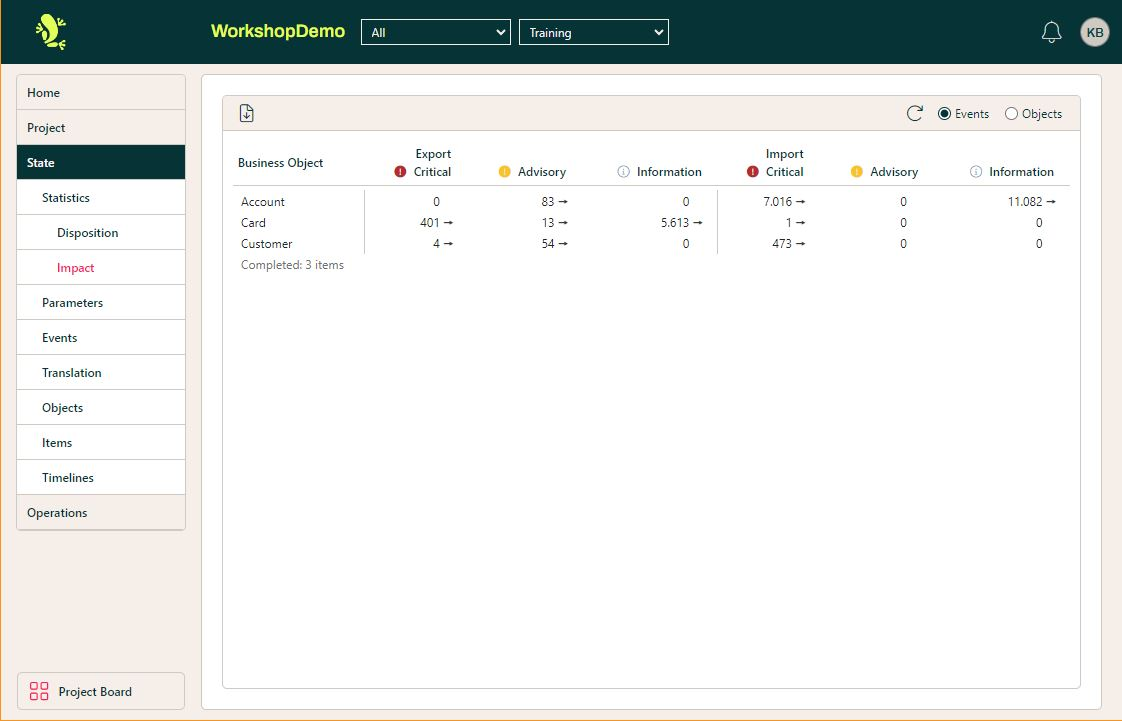
This shows the number of events thrown in each business object and with which Impact and in which part of the process. Choosing Objects instead of events, will show the number of objects which has thrown event(s) with the listed impact and in which part of the process it has been thrown.
When the listed statistics contain events reported back by the target system through Delivery Feedback, a Delivery group is shown after the Import group with those events. The Total group at the right sums Export, Import and Delivery for each Impact type, and is always shown.
Please notice that it’s the total of each Impact type (across Export, Import and Delivery) which is used in the Dashboard.
The Excel export of both lists includes the Delivery columns, and the Impact export also the Total columns.
Delta indicators
Generally in the lists, there is a delta indicator next to each count. The delta indicator compares the current count to the number stored in the current baseline.
The indicators are:
| Indicator | Description |
 | The current count is equal to baseline (unchanged) |
 | The current count is less than baseline. Green if this is good, for instance if the count of discarded Business Objects has decreased. Red if bad, for instance if the count of Business Objects that were imported successfully has decreased |
 | The current count is greater than baseline. Green if this is good, for instance if the count of Business Objects that were imported successfully has increased. Red if bad, for instance if the count of discarded Business Objects has increased |